Rikard Laving
Rikard Laving
Country of birth: Sweden
Visuell saklighet
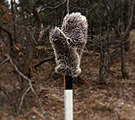
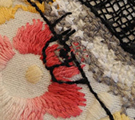
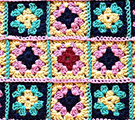
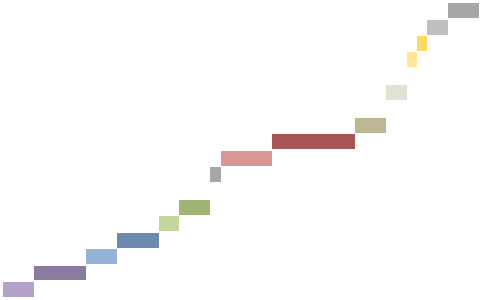
In my project, I use a visual survey to investigate how 50 different people give more or less attention to different visual elements. The elements influencing their choices are perception, culture and their own experiences. The statistical data generated by the survey have been converted into graphical patterns.
The purpose is to communicate facts in a more direct and visual way than presenting them in numerical form, and to find points of contact between the abstract and the concrete.
I mitt arbete undersöker jag genom en bildenkät hur 50 olika personer ger mer eller mindre uppmärksamhet åt olika visuella element. Det som spelar in på deras val är perception, kultur och de egna erfarenheterna. De statistiska data som undersökningen genererat har omarbetats till grafiska mönster.
Syftet är att förmedla fakta på ett mer direkt och visuellt sätt än att presentera det i sifferform samt att hitta beröringspunkter mellan det abstrakta och konkreta.
Syftet är att förmedla fakta på ett mer direkt och visuellt sätt än att presentera det i sifferform samt att hitta beröringspunkter mellan det abstrakta och konkreta.

